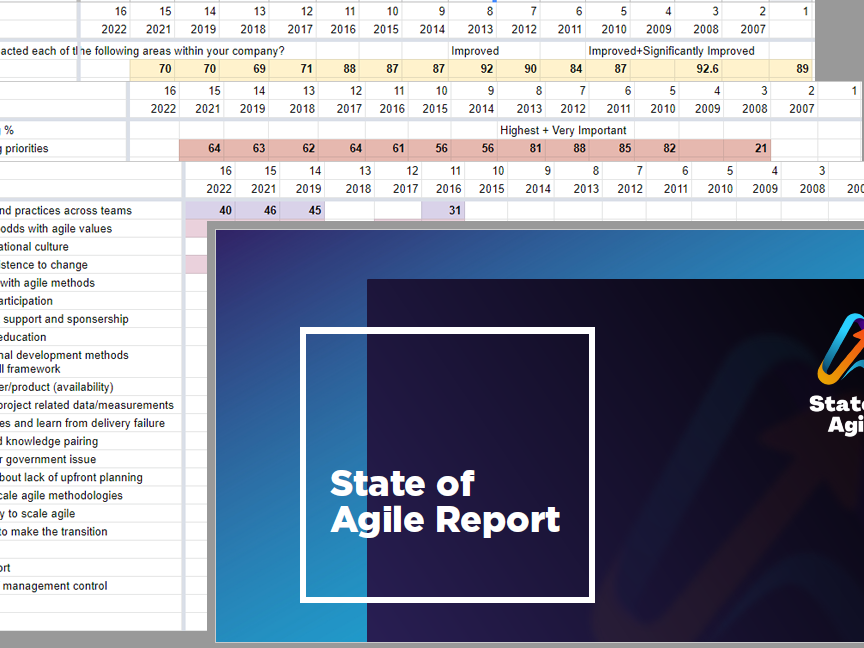
Every year the State of Agile survey consistently includes the results from over 1000 to as many as 6000 respondents who report their experiences and perceptions of the Agile industry along with the role that Agile plays in their organizations.
The survey is very useful for Agile leaders, coaches, thinkers, and developers alike, and it is often quoted as a snapshot representation of the Agile industry, but it does have its limitations.
Chief among them is that respondents generally choose to participate. This is referred to as self-selection bias. One commonly recognized example of this is when customers choose to leave product reviews. Research (and probably your own personal experience) has demonstrated that motivations to participate can vary greatly, and irate customers are more likely to leave reviews than happy ones. As a result we are more likely to believe negative reviews than positive ones (another bias), which of course opens the door for less scrupulous companies to place negative reviews with competitors to benefit themselves.
Another challenge is the regularity with which the format, phrasing, choices, and questions change from one survey to the next. I applaud them for adapting to an ever changing industry, and for refining their methodology, but the inconsistency ensures that each snapshot remains largely that, just a snapshot.
A moment in time is always vulnerable to the influences of the times. Pandemics, economic recoveries, inflation, uncertainty, recessions, the impact of foreign wars, political unrest, and industry downturns are all reflected in the impressive 20 year+ span of survey.
Nevertheless, I still tend to find the surveys useful, even insightful, especially when I glean what trends I can over time which I find more compelling than the results at any one particular moment.

Since 2009, level of adoption, represented by the percentage of teams within an organization that have adopted Agile practices, has remained the same averaging somewhere around 50% (47.25).
This may stem from several things including; issues with scaling Agile, its perceived relevance to non-development teams, or even the appropriateness of Agile for various types of teams and their products or markets. What this certainly does reflect is a split within organizations regarding how they frame their goals, manage teams and teamwork, resolve conflicts and collaboration, and by extension the scope of the forces that shape the cultures of organizations that adopt Agile in any measure.

The level of proficiency in terms of years has steadily grown.
Within any given organization I should hope this would be the case. A steady increase in years of proficiency could indicate a growing maturity within an existing pool of Agile practitioners (likely due to an established and repeating base of respondents). However, absent any other data, it could also reflect a stagnation in the growth of Agile as an industry (or even of the survey), and a failure to reach new organizations. One could imagine an industry growing so rapidly that new adoption dilutes the older adoptions muting the level of proficiency reported over time.

Since 2008, the top five perceived benefits to adopting Agile have remained almost entirely unchanged. This feels significant to me. These included: to enhance the ability to manage changing priorities, accelerating the delivery of software, increasing team productivity, improving business and IT alignment, and to enhance the quality of software.

On the other hand, while the greatest positive impact from Agile adoption has always been reported to be managing changing priorities, and project visibility, the two runners-up have changed.
Since 2006 they used to be team productivity and team morale, but these were replaced since 2016 by improvements to business and IT alignment, and improvements in time-to-market. Why is that?
There may have been a shift in the Agile industry 2016, but of significant note is the fact that in 2017 VersionOne, the company conducting the surveys, was acquired by CollabNet. This shift and the circumstances surrounding it, likely contributed to many of the changes reflected in the results between 2015 and 2017, most of which were consistently reported thereafter. Many influences such as marketing the survey to potential respondents differently could easily result in a shift. For example, a message saying "Be Heard" (which can imply that a respondent has unaired frustrations or thoughts), as opposed to "See what others are saying" can have a dramatic impact not only on who responds, but on how the same respondent perceives their organization while they respond.
Why does this matter? Because nearly all aspects of Agile are influenced by metrics, from j-curves and burndown charts, to classical ROIs. While Agile pushes us to remember the organisms in our organizations we still put our trust in numbers because numbers don't lie.
Yet when we look closely enough behind the numbers we find the truth, the numbers DON'T lie. We see every quantitative rock we rest our decisions and knowledge upon has very qualitative sands that will readily shift beneath them.
In Integral thinking, data is just one facet of our reality, one that cannot be separated from our considerations of the culture guiding our questions, priorities, and assumption, the processes guiding our marketing, designs, or even the motivations behind what information we try to collect, and what information is given.


