
The most accurate way to measure the success of any Agile team, is by validating the actual Business Value delivered with the delivery of working software, and measuring performance based on your Key Performance Metrics to see whether your product is performing to expectations. This is something we call a Long , or Customer Feedback Loop. However, it takes a very long time to envision, design, code, test, and release software into the marketplace, not to mention establishing a user base to observe the performance of your product. While that is an absolutely necessary practice to validate the value proposition of any given product and to take advantage of unforeseen opportunities in customer usage patterns, there are methods that don’t require going all the way to market before getting feedback regarding how much value has been delivered.
One of the most straightforward methods is called Earned Value Management. Excerpted from the linked article:
AgileEVM requires a minimal set of input parameters: the actual cost of a project, an estimated product backlog, a release plan that provides information on the number of iterations in the release. Agile methods do not define how to manage and track costs to evaluate expected Return on Investment information. Therefore the iteration burn-down and burn-up charts (as used in Scrum) do not provide at-a-glance project cost information. Agile metrics neither provide estimates of cost at completion of the release nor cost metrics to support the business when they consider making decisions like changing requirements in a release. AgileEVM does provide this information, and is therefore a excellent extension to the information provided by burn-down charts.
How does it work? A new release is about to begin, we take the known measures:
- The release will span 5 iterations
- The total number of story points is 400
- The total budget of the release is $500,000
As development proceeds, it is a simple matter to calculate by iteration the:
- Planned Value for a given iteration is the Expected Percent Complete multiplied by the Total Budget (20% of $500,000 is $100,000)
- Actual Percent Complete equates to the total number of story points completed divided by the total number of story points planned ( if the teams complete 75 points out of a planned 100, they would be 18.75% complete)
- Earned Value is calculated by multiplying Actual Percent Complete by the Total Budget (15% of $ 500,000 = $ 75,000)
It is easy to see from these numbers that our Earned Value for that sprint is less than what it needs to be for our product to launch successfully. It is also important to note that as scope is discovered, it will be necessary to establish a new baseline, as additional scope will decrease the overall Earned Value of each delivered story point, unless the discovered scope displaces existing scope. Not all scope is created equal Measuring EVM from the perspective of scope delivered does provide additional information, but even more information and accuracy can be derived by measuring Business Value delivered. Assigning value points to stories provides an additional layer of measurement, allowing more complex calculations and conversations to take place. For example:
- 50% of the budget is spent ($250,00)
- 40% of overall scope has been delivered
- Focus on building only the highest value stories means we have delivered 60% of overall Business Value ($300,000)
The addition of the Business Value metric in the above example created a scenario where product management kept the teams focused on only the highest value stories increasing their Earned Value by $100,000. They now have an opportunity to maintain that focus, and as additional scope is discovered, the path forward for dropping the least valuable stories becomes more apparent. Keeping the focus on value minus cost is key to ensuring teams are working only on the highest value items in the backlog.
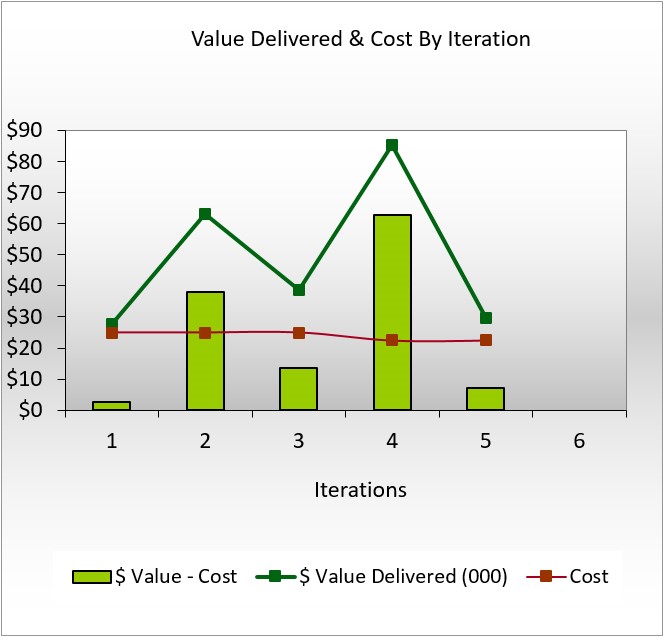
In the chart above the red line represents cost, the green line represents value delivered, and the green bar represents value minus cost. In this example the teams are operating in the positive, if the green bar were to dip below the bottom of the x axis, there might be an indication the teams need more valuable stories to work on. Business Value can also be visualized in a burn down chart similar to the scope burn down charts many tools provide.
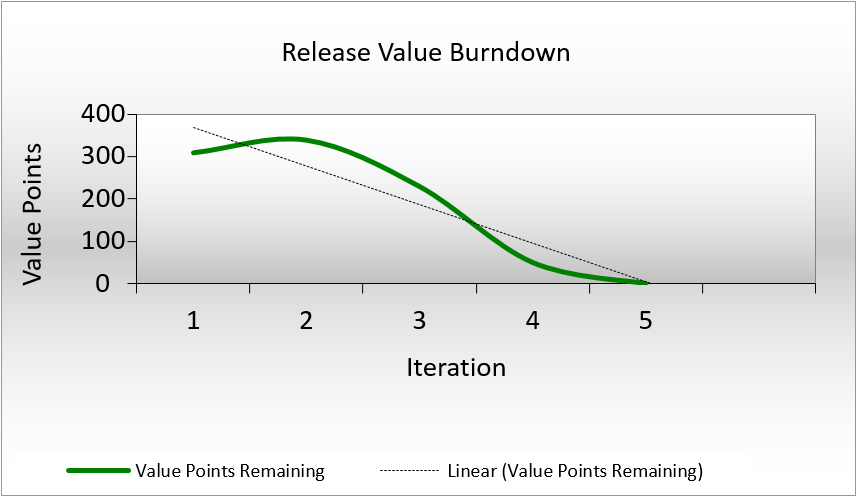
Best practices suggest that the number of value points being delivered should meet or exceed the story points being delivered. If the value points delivered dip below story points it may be an indication that most of the value for that product has been delivered and it might be time to end the release, or go back to your customers to discover more valuable features and stories.